

Engineering Scorecard – Flow metrics
A balanced set of metrics will allow us to publish KPIs to the organisation which are both robust and meaningful to the wider organisation. When introducing the Engineering Scorecard I proposed three categories for the Scorecard:
- FlowMetrics focus on the flow of work through the engineering system, reducing waste and increasing efficiency.
- QualityMetrics assess how well deliverables match their requirements and original intent.
- ValueMetrics focus on the wider value stream and looking end to end at how customer value is generated.
In this Play we will look at choosing flow metrics and in particular choosing your first Flow metric for the Scorecard. As always, this is your decision based on the circumstances for your own organisation. This is a Playbook not a set of rules.
Why a Flow metric?
“Flow” is an analogy from Lean, representing the progression of work through the organisation as the flow of a stream. By looking at what disrupts that smooth flow (“waste” in Lean) we can reduce those disruptions.
We are reducing the time line by reducing the non-value adding wastes
Taiichi Ohno
Cycle time / throughput
Probably the most popular metric adopted to get an overview of how work is flowing through the business is cycle time. This is the average amount of time to complete a work item. If you imagine you are standing at the end of a conveyor belt, counting how long between items coming off the belt, that is cycle time. It can also be represented as throughput, the number of items delivered per unit time. Cycle time is just the reciprocal of throughput. If we produce 5 items a week (throughput) then it takes on average one day to produce one item (cycle time).
Like many Lean measures this comes from a manufacturing environment and is a great measure on a conveyor belt. It is harder to use in a software environment. Remember that we want a clear measure which is understandable by the whole organisation as part of the “language”. In manufacturing, all items are equal. If we’ve rightsized the work, we may have very similar sized items and be able to count them. This simplifies many areas, notably estimation and planning. But in many cases, work items are different sizes and larger ones will, naturally enough, take longer.
We need to understand what items we are measuring. The wider organisation probably cares about features, not backlog items. So should we consider the cycle time of features? These are likely to be varying size and infrequent enough to be affected by statistical variation.
In general cycle time is a more valuable internal tool to assess team flow at the backlog item level than a communication tool. The DORA software metrics include a measure of deployment frequency. This is a carefully focussed cycle time measure, covering how often a software team pushes changes to production.


Velocity
Given the limitation of cycle time measuring unequal sized work items, we could take the item size into account. Rather than counting the work items completed, we sum up the sizes of the work items.
This leads us to looking at Velocity as a measure. At first glance this seems sensible. However, there is no absolute measure of size of work. We would count the amount of work delivered based on an arbitrary relative sizing scale.
Velocity might increase or decrease, not because the team delivers more or less, but because teams use different values and the units change and evolve over time.

Lead time
Lead time is often confused with cycle time, but is a distinct measure. Cycle time is the gap between items coming off the end of the conveyor. Lead time, by contrast, is the time from an item being put on the start of the conveyor to it coming off the end.
The biggest challenge here is agreeing what is the conveyor. Where does the clock start? Is it taking a request from a customer, adding the work to backlog, starting a Sprint or starting the work item. And when does it stop? Finishing the work item, merging to the product, completing the Sprint, delivering to the customer or customer using the feature?
In a small, scaling organization defining lead time in a way to give a valuable KPI is a real challenge. Change, reprioritisation and backlog refinement can make a huge difference, as can batching releases (it is no good completing work in a day if we only release monthly).
Leaad time can be very useful as a tightly focussed measure. For example, DORA looks at change lead time, specifically the time from work being committed to getting into production.


Disruption
Another useful measure is to look at the stability of the iteration process. In Sprint Planning at the start of the iteration, the team sketch out a set of work for the next Sprint. At the Sprint Review at the end they consider progress on the product.
In an ideal world, the team will have delivered most of what they planned to do. Given that work is not fully defined, we don’t want to even aim for 100% alignment. However, when the alignment is very low it suggests that the team are not empowered to follow their plan.
Typically this will show the existence of waste – blockers, handovers, disruptive requests – which are impeding flow. This measure would indicate whether the team has grown out of the highly reactive style of startups.
Sometimes this metric is referred to as “say/do ratio”, but I dislike the naming as it implies some dishonesty or incompetence on the part of the team. I prefer to see this as a measure of the level of disruption to the team’s plans.
Work in Progress
My personal preference for a top level metric is to start with Work in Progress. This seems to be considered less frequently, probably because of its background in Lean rather than Agile.
Work in Progress is the amount of work which has been started but not yet delivered. It is a critical factor in agility as we see in other Plays. It represents cost spent for which no return has yet been seen. I have found it relatively easy to communicate.
Like other measures, Work in Progress can be measured at various levels, for example the number of backlog items currently being worked on within a Sprint.
For a KPI, we want to look at a value stream level. So I would use a Work in Progress metric something like this:
The total amount of work done on incomplete features
There are of course some decisions about how to measure this which will depend on your organisational processes:
- “Total amount” includes all completed backlog items relating to the feature (which requires associating backlog items with features)
- “Work done” can be based on estimates (Earned Value can be used here as with planning and tracking)
- “Incomplete” features are those which have moved beyond some initial investigations but have not yet shipped to customers (this requires tracking feature lifecycles)

Case study – Flow Metric
Let us look at some example data from a past organization with which I worked.
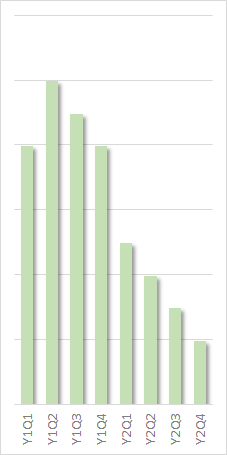
As in most smaller organizations, there had been little thought given to managing Work in Progress. The general perception was that “doing more is good”. This drove parallelism and a mind-set to try and help everyone, all at once. Initially therefore, Work in Progress was expected to be high. Note that as we are measuring a “waste”, low values are good on this chart.
The initial focus was on improving the quality of work tracking and discovering informally managed work. As we became aware of more “background” activities, the amount of measured Work in Progress inevitably increased. Many items which might have been managed informally were now being exposed. This phase lasted one or two quarters with a small increase in Work in Progress. It is important that the underlying root cause be understood and the teams are not immediately blamed for this effect.
Through the first year, Work in Progress then dropped slowly. The main factor here was better backlog management. By prioritising ruthlessly and focussing on the top backlog items, the level of Work in Progress slowly dropped. These changes were mainly at the level of backlog items rather than value stream.
The main drop in Work in Progress came through the second year of change. This was driven by formalisation of value streams. With more focus on value streams came a strong shift to working sequentially through a roadmap. This meant that features were developed in sequence more than in parallel. This was coupled with the growth of the role of Product Owners. These helped to keep the team focussed on the next item.


Leave a Reply